-
Overview
-
Sequence Input
-
Database Search
-
Multiple Alignment
-
Key Annotation
-
Structure Input
-
Paired
-
Tools
-
Miscellaneous
-
Statistics
-
Licence File
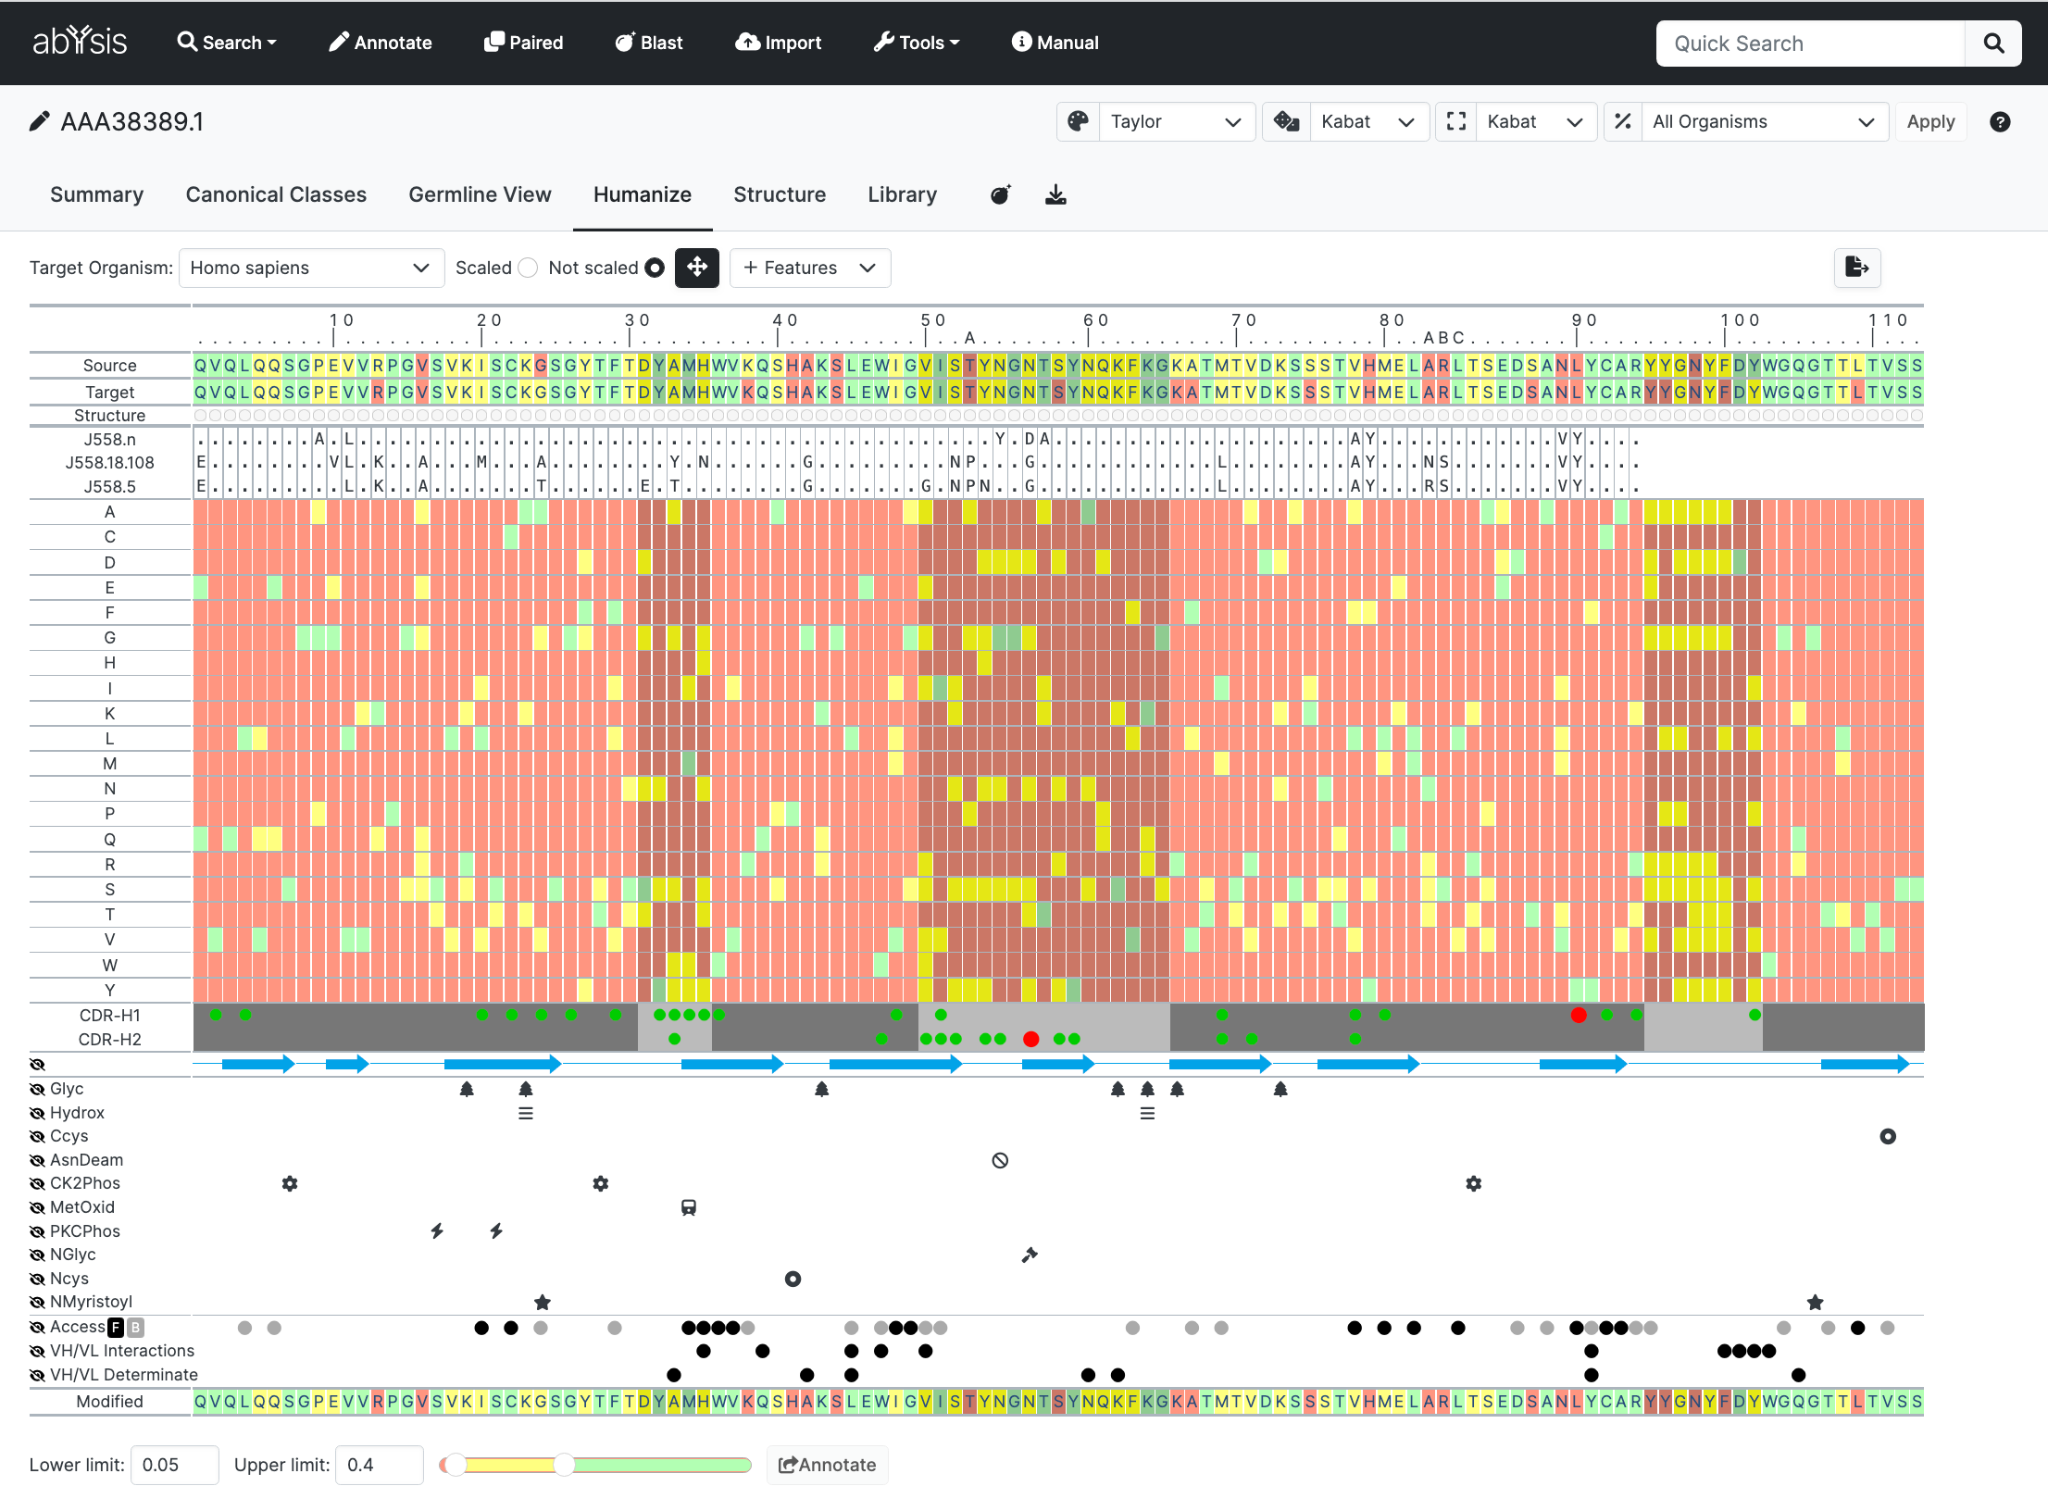
Humanize
This tab provides an alternative view of unusual residues and residue distributions to aid in humanization, de-immunization and optimization studies.
The Humanize tab brings information over from the Canonical Classes and Germline Tabs. Adjusting their displays will be reflected in the Humanize Tab. For instance if you set the Germline Tab to display 5 Germline sequences, the Humanize tab would reflect that.
Sequence rows
Your sequence is shown twice at the top of the display allowing you to score the sequence based on frequencies for two organisms; for example mouse and human. This helps you to quickly identify residues that might be, for example, common in mouse antibodies but rare in human.
Source Organism. Typically you would set this to the species of your query (e.g. mouse).
Target Organism. Normally you would be setting this to human.
Germline rows
The next row gives a condensed view of the Germline display. This will be based parameters used on the Germline View tab, and will change based on settings in that page. Note that it is the translation, not the DNA, which is displayed here.
Heatmap
The main display shows residue frequencies as a 'heatmap'.
Each vertical column can be thought of as looking down on the relevant distribution graph for the Target Organism
Common residues are in green
Unusual residues in Red.
Yellow falls between these.
There is a slider bar to manually adjust the settings to how you would like them. 0.05 = 5%

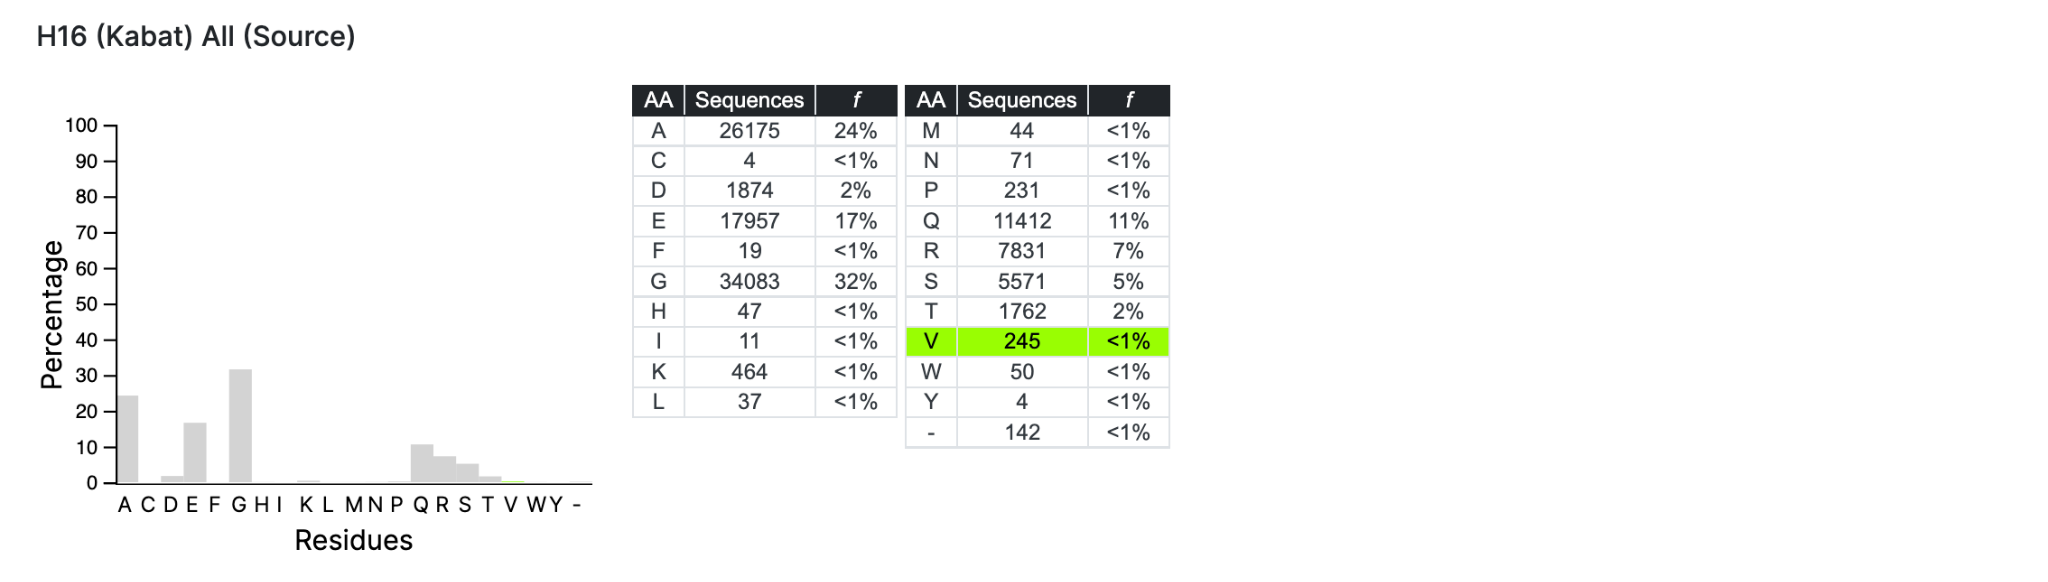
Also you can select a specific residue in Source or Target to see the complete histogram of that position.
Canonical Classes and Structure
CDRs, Secondary structure and solvent accessibility data are displayed below the canonical class data. These are displayed in the same format as the Canonical Classes tab and can be hidden and revealed in the same way.
Hovering over any heatmap cell will show crosshairs to aid location of the cell. In addition, for residues where the is an associated canonical class match or mismatch, the nature of replacement for each CDR is indicated by a popup.
Introducing Mutations
Clicking on a residue in the heatmap will introduce mutate the sequence at the bottom of the heatmap, indicated by a lower-case residue label, updating the colour in that sequence appropriately. Once you have made all your changes your can immediately re Annotate

Display controls detail
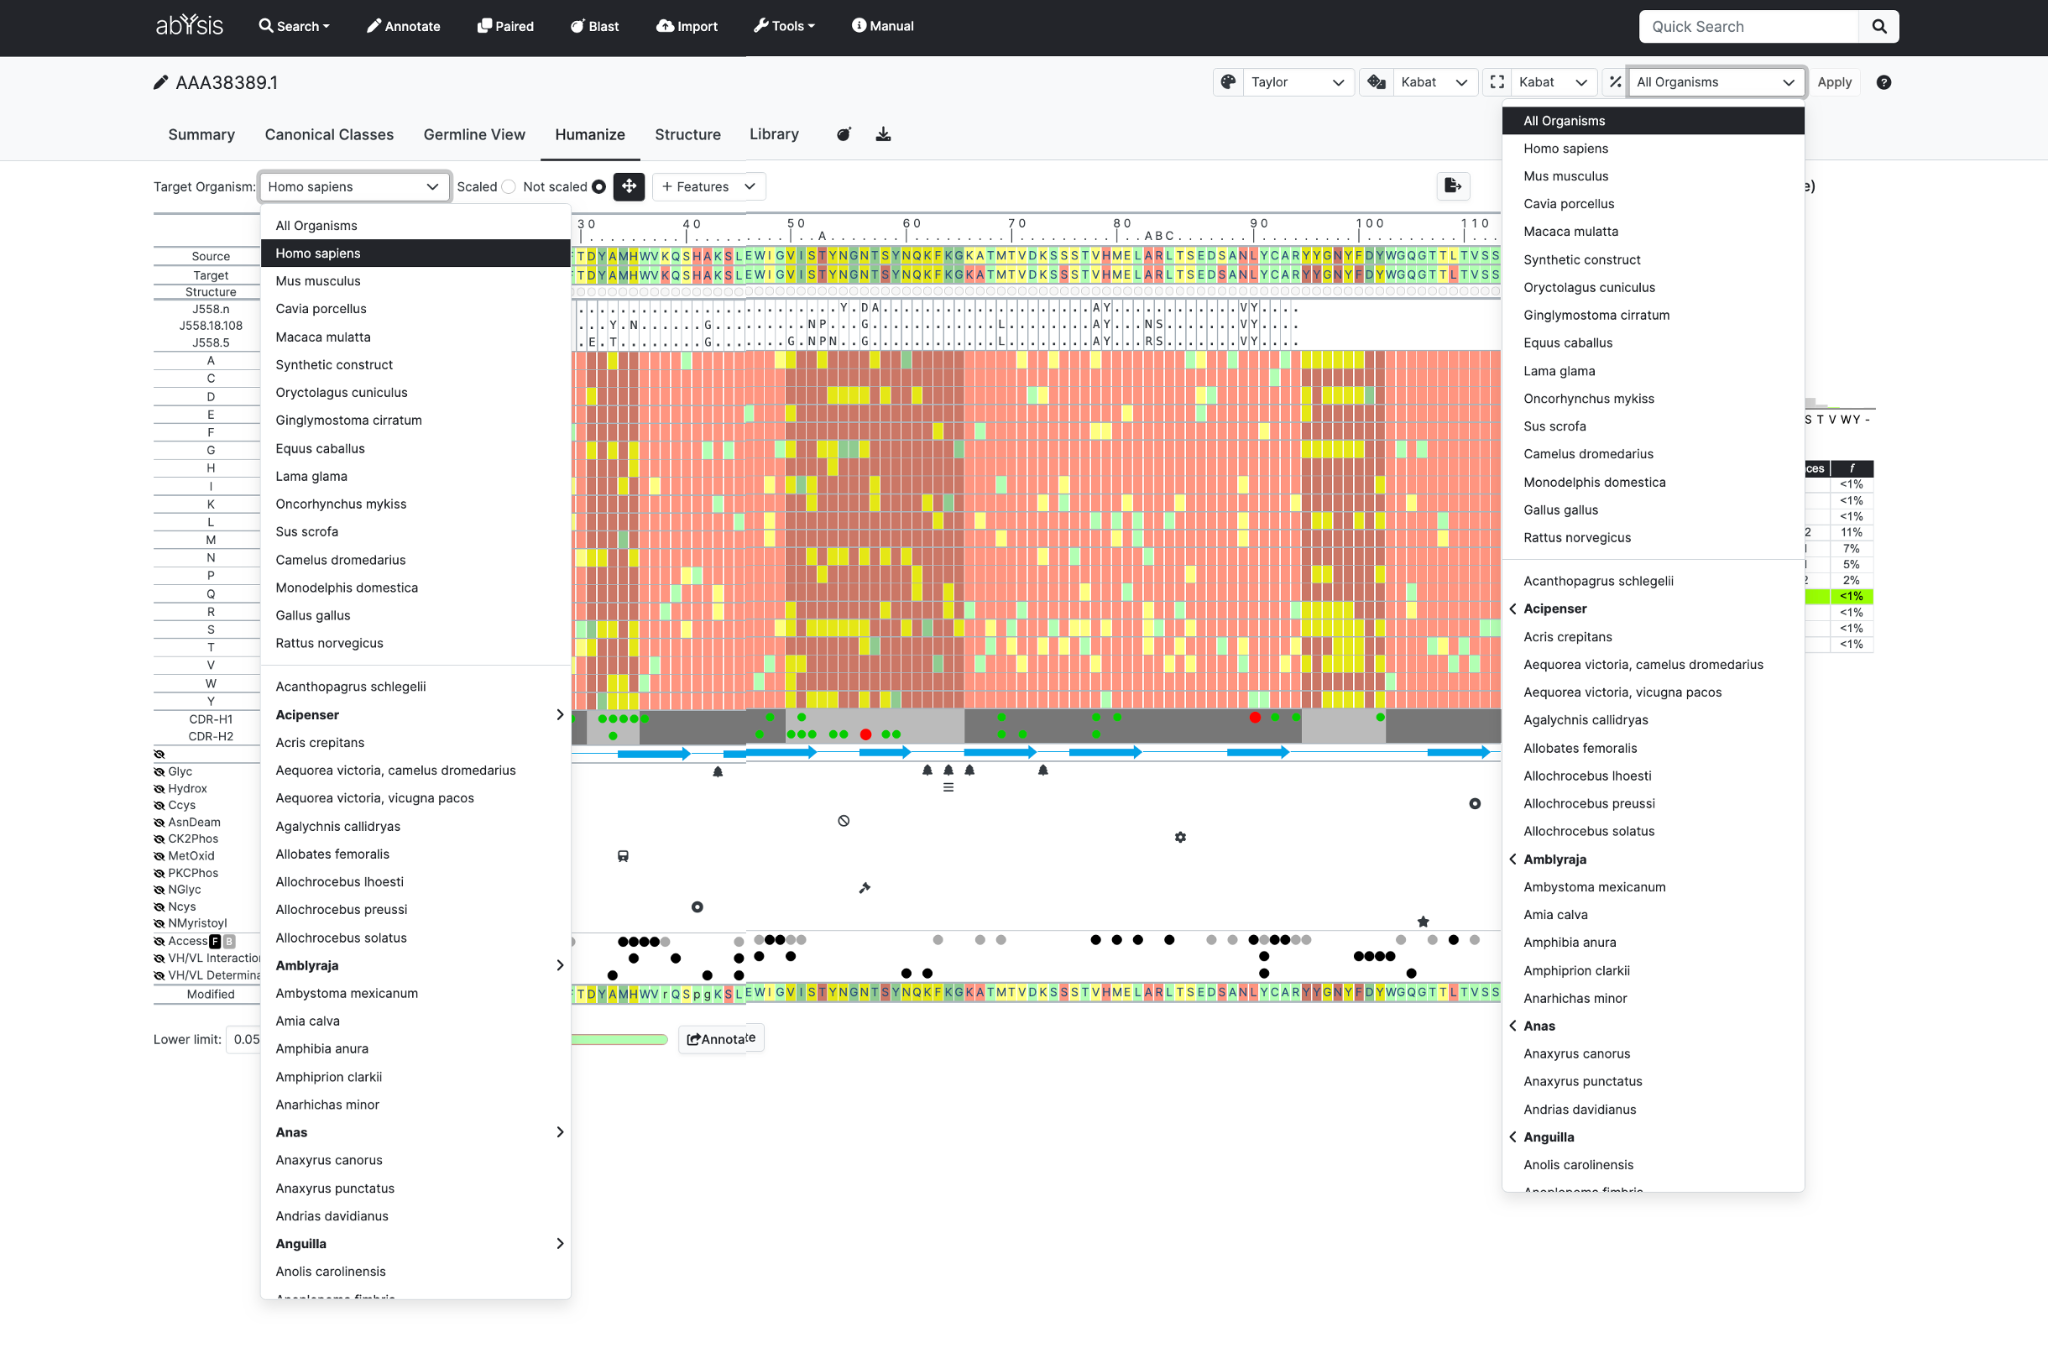 The Source Organism dropdown is the organism listed in the Global to be selected which is used for colouring the sequence in the first row of the heatmap table.
Target Organism dropdown allows the organism to be selected which is used for colouring the sequence in the second row of the table and in the main heatmap..
Scaled / Not Scaled radio-buttons

Select whether the colouring of the heat map uses the raw percentages (Not Scaled) or the scaling relative to the most common residue at that position (Scaled). For the latter, the most frequent residue will always be 100%.
Crosshair icon toggle

Determines whether they are active or hidden when moving the mouse over the heatmap.
Export button Excel again exports data from all Tabs. Mutations are not displayed in Excel until the mutated sequence has been through Annotate itself.